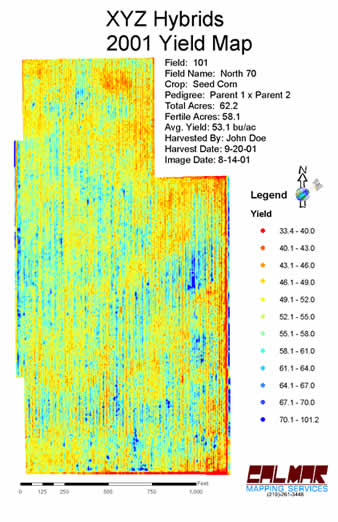
We
can also create yield maps for growers without yield monitors
or for specialty crops where conventional yield monitors do not
work.
These yield maps rely upon 3 different sets of information. The
first is a remotely sensed image of the crop in the latter stages
of the growing season, typically mid to late August. Second, prior
to harvest we would collect hand check yield samples from specific
locations within each field. The locations are determined based
on analysis of the aerial image, and selected according to apparent
crop health and yield potential. The final piece of data is the
total yield for each field, or if more than one variety is planted
in a single field, a total yield for each variety. These total
values can be from a non-GPS equipment yield monitor, scale ticket
weights, or other methods. We then combine these values with the
imagery to create a yield map. Click
here to see an article about this procedure that was published
in Indiana Prairie Farmer magazine.

Accuracy:
The accuracy of these yield maps is impressive. Due to the methods
used, the average yield from the yield map is always within a
few tenths of a bushel per acre of the reported average (calculated
from the total area and the total weight). Testing the accuracy
on a point to point basis with a conventional yield monitor is
also very close. In some ways, accuracy of the imagery yield map
is superior to that of the conventional map. This is due to the
"lag" time associated with conventional yield monitors.
Even though most mapping software has a factor to reduce the effects
of lag, it is often difficult to eliminate errors associated with
lag. However, with a yield map created from imagery, there is
no lag. Each point represents the yield in exactly that location.
In other words, the "spatial accuracy" of the yield
maps from the imagery is superior to that of a conventional yield
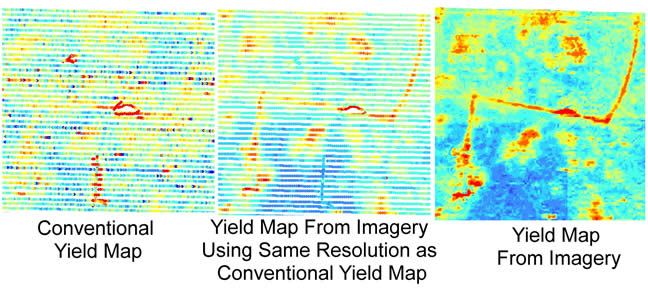
monitor and map. Minute features in a yield map, which can be
difficult to locate in conventional yield maps, are often much
easier to spot in maps from imagery. In addition, our imagery
yield maps are created with one point representing one 30"
by 30" square of ground area whereas a single point in a
conventional yield map represents areas of 10' by 5' or more.
Therefore, the resolution of our imagery maps is higher than conventional
maps. This also makes defining small areas in a field easier.
These differences are shown in the example below. The small, zig-zag
waterway is barely visible in the map from the conventional yield
monitor (left), it is more easily visible with the improved spatial
accuracy of the center image, and is unmistakable in the full
resolution yield map from the imagery (right).

Uses:
It should be noted that these maps are not predictive yield maps.
The necessary hand check yield samples and the final total yield
numbers make these yield maps a post-harvest endeavor. These maps
can be used as an additional layer in nutrient management planning.
They can also be used in quantifying losses associated with drainage
issues. Having yield information can aid in determining the economic
feasibility of a new drainage system.
Previous
Page